The Government is not publishing KS2 schools data for the 2021/22 academic year. Schools have been advised to continue displaying our most recent published KS2 performance measures which were from 2019. We are looking forward to publishing our KS2 level data in 2023.
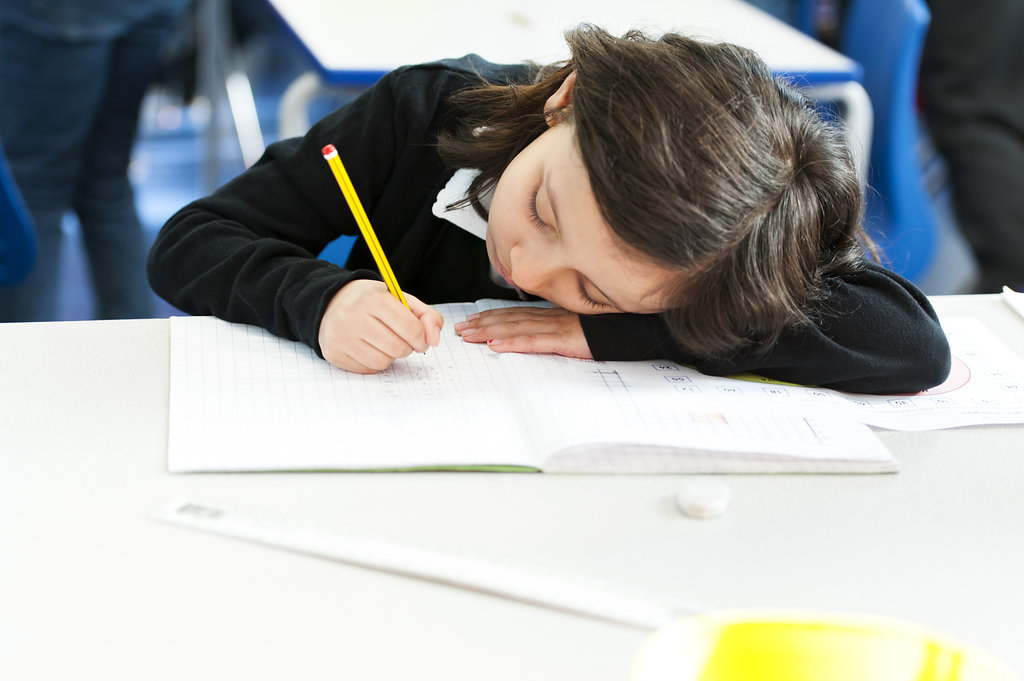
Assessment and testing
In 2019 the Year 6 pupils achieved well above the national average in reaching the expected standard for reading, writing, spelling, punctuation & grammar. The combined percentage achieving reading, writing & maths is 87% compared to 65% nationally. We maintained a higher proportion of pupils achieving the greater depth standard.
2019 Results
Subject
Expected standard
Greater depth/higher standard
Reading
87%
40%
Writing (teacher assessment)
93%
37%
Maths
100%
33%
Grammar, Spelling & Punctuation
93%
70%
Science (teacher assessment)
93%
Not applicable
Reading, writing and maths: percentage of pupils achieving the expected standard in all three subjects
87% (National average 65%)
Average reading progress score
5.4
Average writing progress score
5.3
Average maths progress score
5.9
Average score in reading test
108 (National average 104 )
Average score in maths test
109 (National average 106)
Average score in SPAG
111 (National average 105)
2018 Results
Subject
Expected standard
Greater depth/ higher standard
Reading
93%
43%
Writing (teacher assessment)
96%
54%
Maths
96%
50%
Grammar, Spelling & Punctuation
96%
54%
Science (teacher assessment)
96%
Not applicable
Reading, writing and maths: percentage of pupils achieving the expected standard in all three subjects
93%
Average reading progress score
1.76 (Average)
Average writing progress score
4.57 (Well above average)
Average maths progress score
4.11 (Well above average)
Average score in the reading test
108.6 (National average 105)
Average score in the maths test
110.1 (National average 105)
2017 Results
Subject
Expected standard +
Greater depth/ high standard
Reading
83%
52%
Writing (teacher assessment)
90%
41%
Maths
93%
55%
Grammar, Spelling & Punctuation
86%
59%
Science (teacher assessment)
97%
Not applicable
Reading, writing and maths: percentage of pupils achieving the expected standard in all three subjects
76%
Reading, writing and maths: percentage of pupils achieving a high score in all three subjects
38%
Progress measures KS1-KS2
Average reading progress score
3.7 (confidence interval 1.4 to 6.0)
Average writing progress score
3.3 (confidence interval 1.1 to 5.5)
Average maths progress score
4.1 (confidence interval 2.0 to 6.2)
Average scaled score per pupil
Average scaled score per pupil in reading
109
Average scaled score per pupil in grammar, spelling and punctuation
110
Average scaled score per pupil in maths
110
Average scaled score per pupil: the expected standard in the tests is a scaled score of 100 or above. In 2017 the threshold for a high score in a test was 110. Our average score per pupils are at the higher threshold.
Progress measures aim to capture the progress that pupils make from the end of infants (end of Year 2) to the end of juniors (end of Year 6). They are a type of value added measure which means pupils’ results are compared to the actual achievements of other pupils nationally with similar prior attainment. The school’s progress scores are calculated as its pupils’ average progress scores. The school level progress scores are presented as positive and negative numbers either side of zero.
A score of 0 means pupils in this school do about as well at key stage 2 as those with similar prior attainment nationally.
A positive score means pupils on average do better at key stage 2 than those with similar prior attainment nationally.
A negative score means pupils do less well at key stage 2 than those with similar prior attainment nationally.
Key:
KS2 – Key Stage 2
SPAG – Spelling, punctuation and Grammar
TA- Teacher assessment
For more information about end of Key Stage 2 tests please look on the Department for Education (DfE) school performance tables website.